In our last post, we explored how bundled payments affect spending, utilization, and quality of care. Today, we turn to an equally important question: how do we design bundles that are fair for both patients and providers?
This blog is organized as follows:
Fee-for-Service (FFS) Model: Volume over Value
Under the traditional Fee-for-Service (FFS) model, every test, procedure, or therapy session is billed individually. For example, if someone undergo a hip replacement, he or she will be billed individually for surgeon’s time, facility utilization, laboratory tests (CBC, Hb1C, etc), imaging scans (knee X-ray, etc), and more.
FFS often rewards volume over value—the more services performed, the higher the total payment. This structure is not directly tied to patient outcomes or cost-effectiveness, creating limited incentives for providers to focus on efficiency, coordination, or long-term results.
The Promise of Bundled Payments
In bundled payment model, a single fixed payment covers all services for a patient’s full episode of care (for example, everything related to a hip replacement). This approach encourages doctors and hospitals to work together, manage resources wisely, and avoid unnecessary treatments while maintaining quality care.
Beginning in January 2026, CMS will introduce a new bundled payment program—TEAM—designed to enhance the patient experience from surgery through recovery by strengthening care coordination and improving transitions between providers.
One of the biggest barriers to adopting bundled payments is provider risk. Consider two patients admitted for the same condition—one experiences complications, while the other does not. The cost difference can be substantial. Zhang et al. (2017) offers a mathematical framework to better understand and manage this variation across cases [1].
Using Data to Define Smarter Bundles
Zhang et al. (2017) applied a data-driven clustering approach to this problem, showing that claims data can uncover patient sub-groups with very different care needs and costs [1]. These clusters can form the building blocks for smarter, fairer bundled payments.
To uncover patterns in treatment and costs, the researchers analyzed a vast set of insurance claims from 1.6 million residents across nine counties in New York, covering the years 2007 to 2013. To ensure consistent results, they focused on a single year (2007) and selected the largest hospital provider for each condition, this helped minimize inconsistencies in how medical codes were recorded.
The study examined two major conditions:
- Total Knee Replacement (TKR) – 460 patients, ICD-9 code 715.36
- Congestive Heart Failure (CHF) – 507 patients, ICD-9 code 428.0
Altogether, the researchers identified over 1,000 unique service codes for TKR and nearly 1,900 for CHF. Yet only about 1% of these services appeared in more than half of the patients—revealing just how much care can differ from one person to another, even for the same diagnosis.
To simplify this complexity, the team used the Clinical Classifications Software (CCS) to group thousands of codes into meaningful categories. This reduced the data to 88 service groups for TKR and 168 service groups for CHF. This streamlined structure allowed the researchers to use clustering algorithms to identify patterns of care, helping hospitals understand which combinations of services typically occur together and where costs vary the most.
| Condition | Patients | Unique Services Identified | Services Used by >50% of Patients |
| Total Knee Replacement (TKR) | 460 | 1,063 | 12 (1.1%) |
| Heart Failure (CHF) | 507 | 1,898 | 19 (1.0%) |
Table 1 shows that for Total Knee Replacement (TKR) and Congestive Heart Failure (CHF), thousands of distinct services were identified yet only about 1% were common to more than half of patients. This highlights how different hospitals treat patients for the same condition.
Case Study 1: Knee Replacements
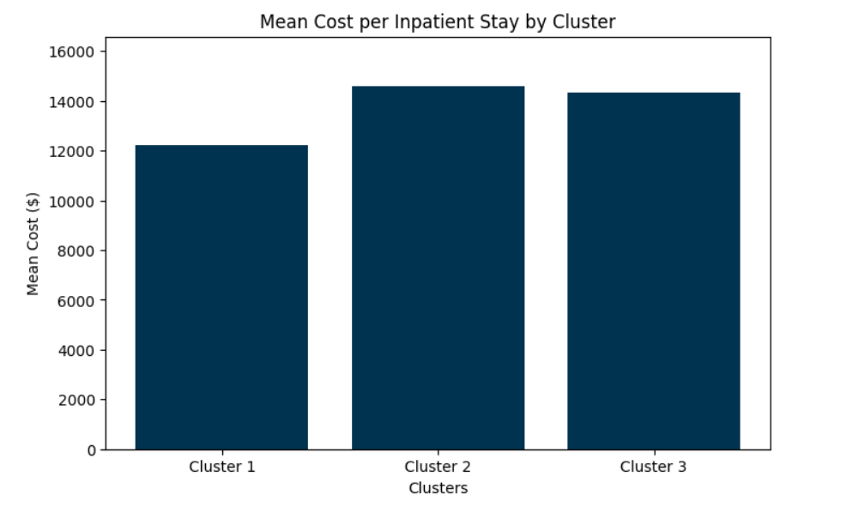
In the knee replacement case study, three major clusters of patients emerged:
| Cluster | Total Cost per Patient ($) | Key Features | Cost Profile |
| 1 | 12,232 | Standard surgery + intensive care (blood transfusion, special drugs) | Lowest average cost, highest variation |
| 2 | 14,585 | Standard surgery + minor add-ons (catheter insertion) | Highest cost, stable variation |
| 3 | 14,330 | Surgery + extra diagnostics (ECG, CT scans) for cardiac concerns | Higher cost, similar variation to Cluster 2 |
- Cluster 1 required standard knee surgery plus additional intensive care, such as blood transfusions and specialty medications. These cases had the lowest average cost ($12,232) but the greatest variation, reflecting unpredictability in post-surgical needs.
- Cluster 2 represented mostly routine surgeries with minor add-ons (like catheter insertions) and showed the highest average cost ($14,585) but the most consistent outcomes.
- Cluster 3 involved patients who needed extra diagnostics—such as ECGs and CT scans—due to possible cardiac conditions, resulting in a slightly lower cost ($14,330) than Cluster 2 but similar stability.
Case Study 2: Heart Failure
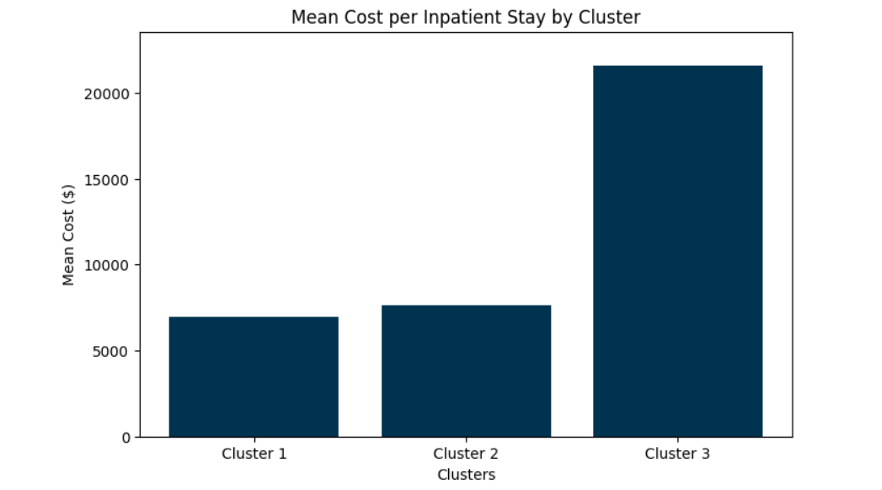
Heart failure is much more complex. Three dominant clusters captured 78% of patients:
| Cluster | Total Cost per Patient ($) | Key Features | Cost Profile |
| 1 | 6,962 | Heavy ER use, respiratory services, rehab (PT/OT) | Lower cost, stable variation |
| 2 | 7,661 | Renal failure comorbidity, frequent dialysis | Moderate cost, higher variation |
| 3 | 21,563 | Pacemaker/defibrillator surgeries | Highest average cost, largest variation |
In contrast, the heart failure study revealed much higher variability in both treatment and cost.
- Cluster 1 patients often entered through the emergency room, receiving respiratory and rehabilitation services, leading to lower costs and relatively stable variation.
- Cluster 2 included patients with renal complications who frequently required dialysis, resulting in moderate costs and greater variability.
- Cluster 3 represented the most complex cases—patients undergoing pacemaker or defibrillator surgeries—with the highest average cost ($21,563) and largest variation, indicating significant financial risk for providers under a flat payment model.
Conclusion
Bundled payments work best when they reflect the real variation in patient care. By using claims data to cluster patients, we can design bundles that are both fair and financially sustainable. Additionally, by estimating the probability of complex occurrences, we can incorporate the expected cost of those complications into a single, comprehensive bundle price.
At Care Cadet, we believe this data-driven approach can help providers join the move toward value-based care while protecting patients and keeping costs in check.
Reference
Zhang, W., Bjarnadóttir, M. V., Proaño, R. A., Anderson, D., & Konrad, R. (2018). Accelerating the adoption of bundled payment reimbursement systems: A data-driven approach utilizing claims data. IISE Transactions on Healthcare Systems Engineering, 8(1), 22–34. https://doi.org/10.1080/24725579.2017.1402107